Licensing information
This graphical, interactive IPM facility (variously called the IPM Report, Pest Mapper and Pest Viewer) is a separately licensed EMu option. Please contact us for licensing information.
The Traps and Pest Events modules and a range of Excel Pivot Table reports are available in the EMu Art and EMu Museum clients.
EMu's Integrated Pest Management facility also includes a powerful, web-based tool for visualizing your pest data on interactive maps and floor plans of your institution.
To run the IPM Report:
- Search for records in the Pest Events module.
-
From the Ribbon, select Home>Reports to display the Reports box:
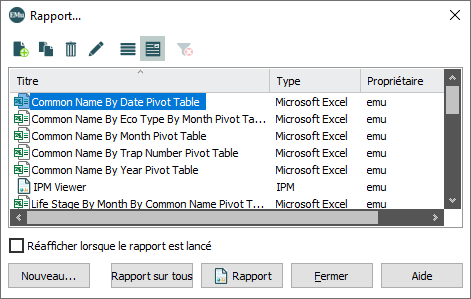
- Select IPM Viewer.
Note: The IPM Viewer may be named differently (e.g. IPM Report, Pest Mapper) in your EMu system.
- Click Report to generate the report using the current L'enregistrement actuellement affiché en Vue de Détails ou mis en évidence en Vue de Liste (il est entouré d'une légère ligne pointillée). On ne peut avoir qu'un seul enregistrement en cours à la fois. record or selected Une notice sélectionnée a été choisie soit seule ou parmi un groupe d'enregistrements. Il est habituel de sélectionner les enregistrements que vous souhaitez voir affectés par une opération avant d'effectuer celle-ci. Les enregistrements sélectionnés sont utilisés dans de nombreux cas, par exemple lorsque l’on souhaite les rejeter, les sauvegarder dans un groupe ou les attacher à un autre enregistrement. Un enregistrement sélectionné s'affiche à l'écran avec un fond bleu lorsqu'il est en vue de liste. records
-OR-
Click Report All to generate the report using all listed records.
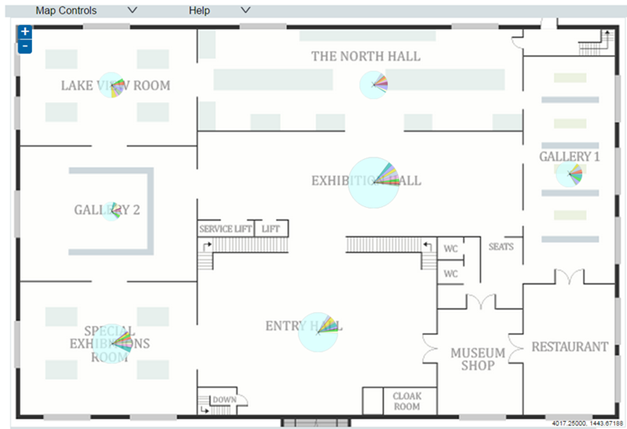
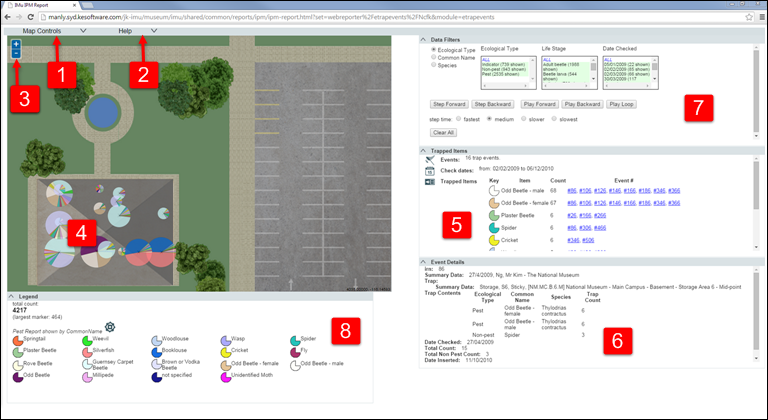
Your default web browser will open and display an interactive, graphical representation of your pest data mapped to ground and floor plans and various other views of your institution:
|
Ref |
Name |
Description |
|---|---|---|
|
1 |
Map Controls |
Click |
|
2 |
Help |
Click
Click |
|
3 |
Zoom in / out |
Increase / decrease the zoom of the main map display. See the on-screen Help (2) for alternative methods for zooming in / out. |
|
4 |
Graphical representation of an infestation |
Click on a pie-chart to display infestation details to the right of the map in the Trapped Items panel (5). |
|
5 |
Trapped Items |
The Trapped Items panel only displays when a pie-chart is clicked (4). When a pie-chart is clicked, details of the infestation are displayed in the Trapped Items panel:
Each Event # is the IRN of a record in the Pest Events module. Click an event (hyperlink), e.g. #86, to display details of the event in the Event Details panel (6). |
|
6 |
Event Details |
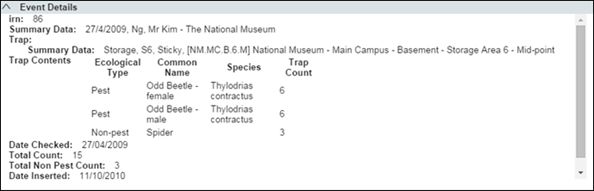
The Event Details panel only displays when an event (hyperlink) is clicked in Trapped Items panel (5). When an event (hyperlink) is clicked, details of the event display in the Event Details panel:
|
|
7 |
Data Filters |
Various filters to control what data displays on a view of your institution (map / elevation etc.) when:
|
|
8 |
Legend |
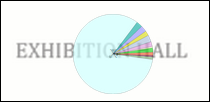
In this example, pest infestation data is graphically represented by Common Name:
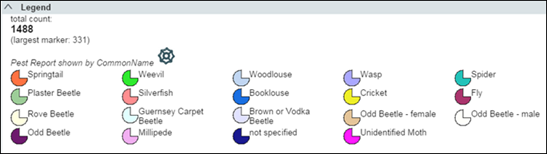
The Legend, which displays beneath the map, explains the colour coding used in the pie-chart:
What displays in a pie-chart is determined by the option selected in the Show by drop list. See Map Controls for details. |
 to display a drop list of options to customize the viewer and to select different views (different floor / ground plans). See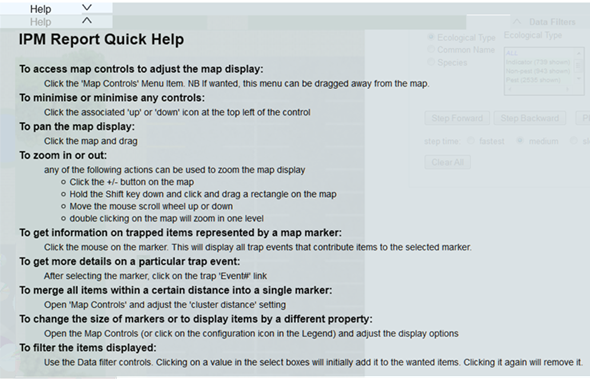
 to collapse (hide) the on-screen Help.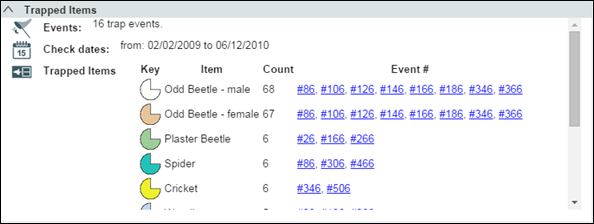
 Data Filters
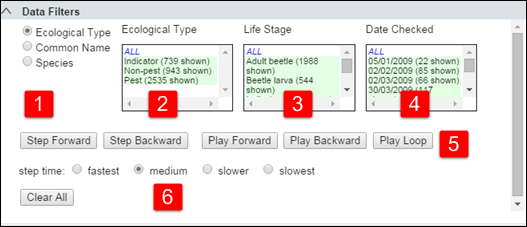
Various filters to control what data displays on a view (floor plan / elevation / site plan) when:
- Manually stepping forward / back along a timeline.
- Playing forward / back an entire timeline.
- Looping an entire timeline.
|
Ref |
Object |
Description |
|---|---|---|
|
1 |
Radio Button |
Selecting a radio button determines which list displays at 2. In the screenshot above, the Ecological Type radio button is selected and the list in box 2 is of various ecological types. You would select the Common Name radio button to change box 2 to a list of pests by Common Name, and so on. |
|
2 |
Pests / ecological types |
Click All or select one or more item in the list to filter which pests / ecological types are tracked when the timeline is played. |
|
3 |
Life Stage |
Click All or select one or more item to filter which life stage of the pests / ecological types selected in box 2 are tracked when the timeline is played. |
|
4 |
Date Checked |
Click All or select a range of dates for your timeline. |
|
5 |
Run |
Options include:
Note: The |
|
6 |
Speed |
Increase / decrease the speed at which the timeline is run. |
|
|
|
Click to reset boxes 2, 3 and 4 to their default setting (All). |
 /
/  .
. /
/  to run through the entire sequence of dates (as if animated).
 to run through the entire sequence of dates (as if animated) until
  is clicked.
 Map Controls
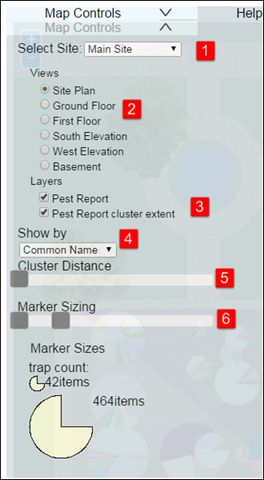
Note: Your version of the IPM facility may have different options and / or labels.
|
Ref |
Control |
Description |
|---|---|---|
|
1 |
Select Site |
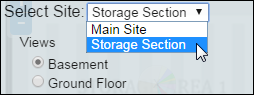
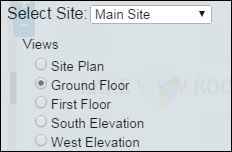
Various Sites can be displayed, each with one or more Views (maps / floors / elevations, etc.) upon which your pest data is mapped. In the screenshot above, the Main Site is selected. It has six available Views. We select a different site, Storage Section, which has two available Views:
|
|
2 |
Views |
Each Site has one or more Views (maps / floors / elevations, etc.) upon which your pest data is mapped. Select the radio button for one of the Views to map your pest data against that View. In this example we select Ground Floor:
The Ground Floor map displays with your pest data mapped to it:
|
|
3 |
Layers |
Hide / show various layers on each view:
|
|
4 |
Show by |
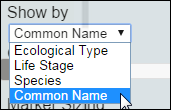
Your pest data can be presented graphically in various ways. For example:
In this case an infestation is graphed by Common Name:
In this case the Legend, which displays beneath the map, explains the colour coding used in the Common Name pie-chart:
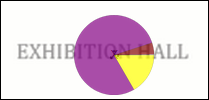
Selecting a different option from the Show by drop list changes the pie-chart representation of the infestation. In this case, Life Stage has been selected:
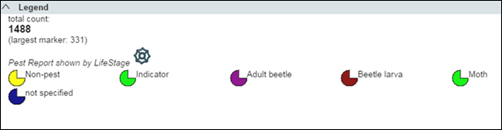
The Legend adjusts accordingly:
|
|
5 |
Cluster Distance |
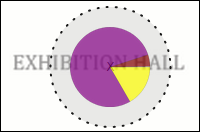
Move the slider to increase / decrease the area within which pests are recorded. The usefulness of this option depends on the view selected. As with the Pest Report Cluster Extent Layer (see above) this option has limited usefulness on a floor plan as all incidence of pests in a location are typically caught in the same trap:
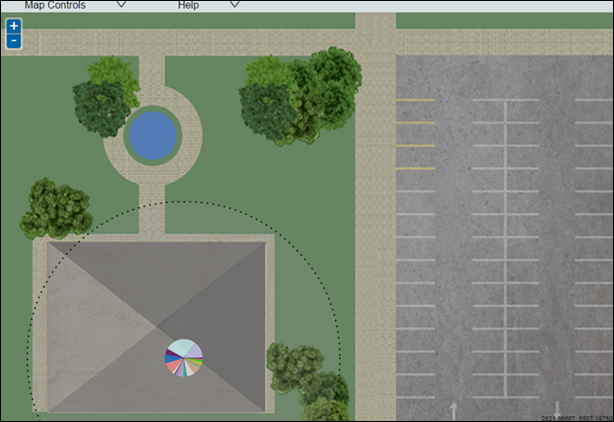
On a Site Plan or Elevation, the Cluster Distance is far more useful. Consider this example:
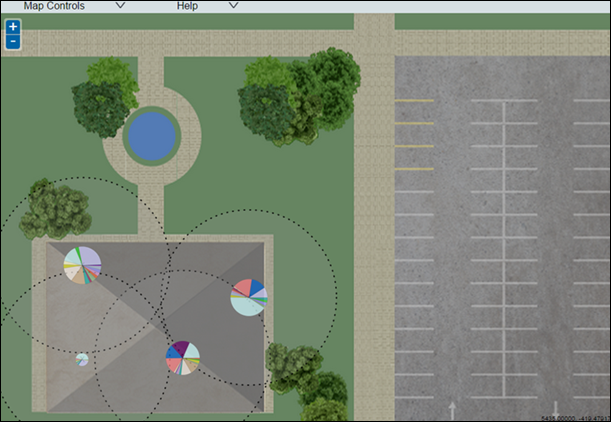
The radius of the Cluster Distance is large (indicated by the dotted line). The pie-chart presents details of all incidence of pests captured within the radius of the Cluster Distance. As we reduce the size of the Cluster Distance, we zoom in on the data for finer granularity:
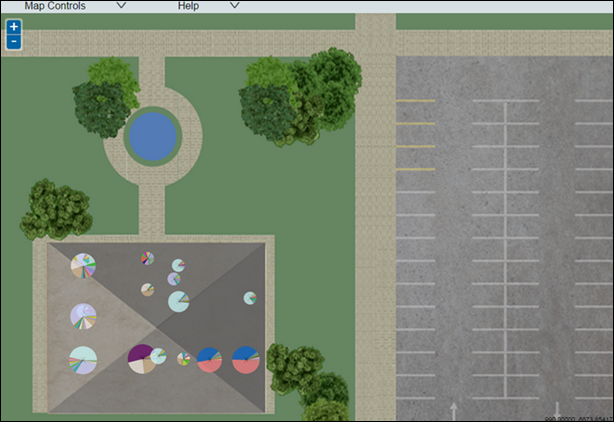
Reducing the radius further reveals all recorded incidence of pests:
|
|
6 |
Marker Sizing |
Move the slider to increase / decrease the size of the pie-chart representation of the infestation:
|
|
|
|
Click to collapse (hide) the Map Controls. |